Having trouble choosing which statistical test to use for your data?
The good news is you don’t need to memorise every single test. While it’s important to be familiar with the requirements for the most commonly used tests, it’s unlikely you will be expected to recall them from pure memory.
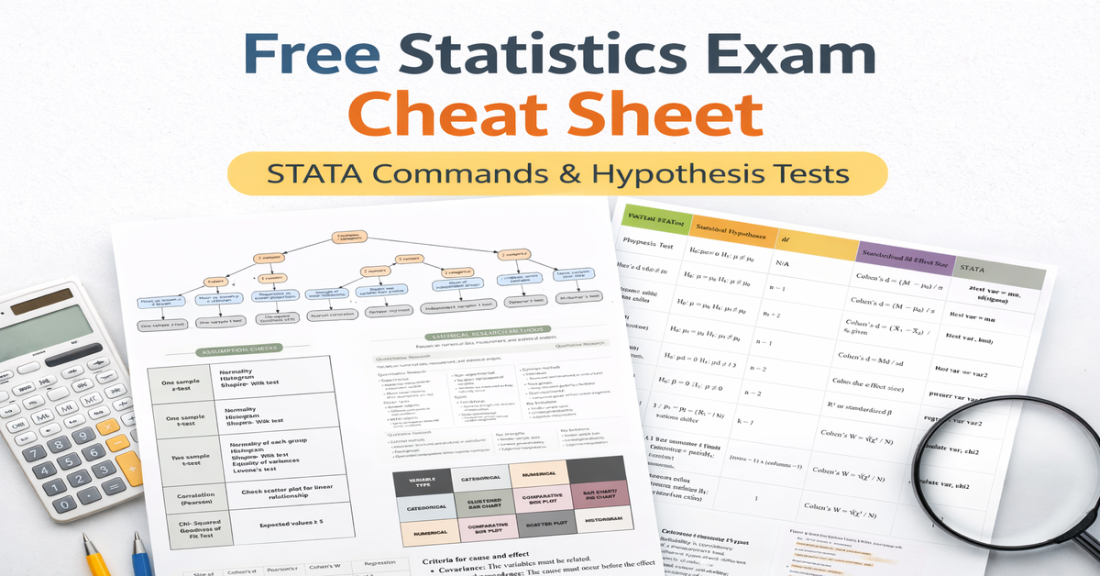
Most exams will allow you a cheat sheet and if you’re writing a report, you can always look up your notes. That being said, this simple table and diagram is compact and has all the information you need to help you select the appropriate tests depending on your variables.
It’s small enough to print, add to your cheat sheet or just keep on hand for your next Stats practical.
Download the simple diagram here:
| What is your research question? | Your variables look like… | Test |
|---|---|---|
| Compare 2 groups (difference in averages) | DV = continuous (e.g., test score) IV = 2 groups (e.g., male vs female) | Independent Samples t-test |
| Compare the same people twice (before/after) | DV = continuous Same participants measured 2 times | Paired Samples t-test |
| Compare 3+ groups (difference in averages) | DV = continuous IV = 3+ groups | One-Way ANOVA |
| Relationship between 2 continuous variables | X = continuous Y = continuous | Pearson Correlation (r) |
| Association between 2 categorical variables | Variable 1 = categorical Variable 2 = categorical | Chi-square Test of Independence (χ²) |
| Predict a continuous outcome from 1+ predictors | Outcome = continuous Predictors = continuous and/or categorical | Linear Regression |
| Compare group averages while controlling another variable | DV = continuous IV = groups + covariate (continuous) | ANCOVA |
| Compare a mean to a known value | DV = continuous Compare to a “test value” | One-Sample t-test |
Before you go…
Prepping for an exam?
Check out my Free_Statistics_Exam_Cheat_Sheet_ for a comprehensive double sided cheat sheet that will help you ace your test!
-T.

Leave a comment